For University of Exeter CLES courses based on Cornwall campuses(including students on BIOM4009 and MSc courses):
There are limited 1:1 bookings throughout the year based on PGR tutor availability. Click on one of the PGR tutor profiles below to book a 1:1 appointment using your University email. You will receive calendar confirmation through your University Outlook account. Once booked, appointments can be arranged with the tutor online through Teams or in person on campus.
Please contact the ASK team if you have any questions about booking.
Undergraduate Biosciences (BIO3136) 1:1 tutorials:
Need help troubleshooting R? Undergraduate Bioscience BIO3136 students in their final dissertation year are offered one 45-minute appointment with a PGR Stats tutor. Appointments are made available on a week-to-week basis as tutors allocate their time based around their PhD studies. These can be booked between 15th January and 26th March 2024 (for BIO3136 students who have deferred their projects, there are limited bookings beyond these dates depending on PGR tutor availability).
Use your appointment wisely! Before your appointment, you need to have all your data organised in one R-readable document, such as a spreadsheet; and have tried the statistical test you think you need to do AND identified at which stage of the process you got stuck. The tutors cannot tell you what to do, they can only help you with R troubleshooting!
Cancellations can be made up to 24 hours before the time of your tutorial by emailing the tutor and ASK team. BIO3136 Students: if you miss your appointment without cancelling, you will not be able to book another.

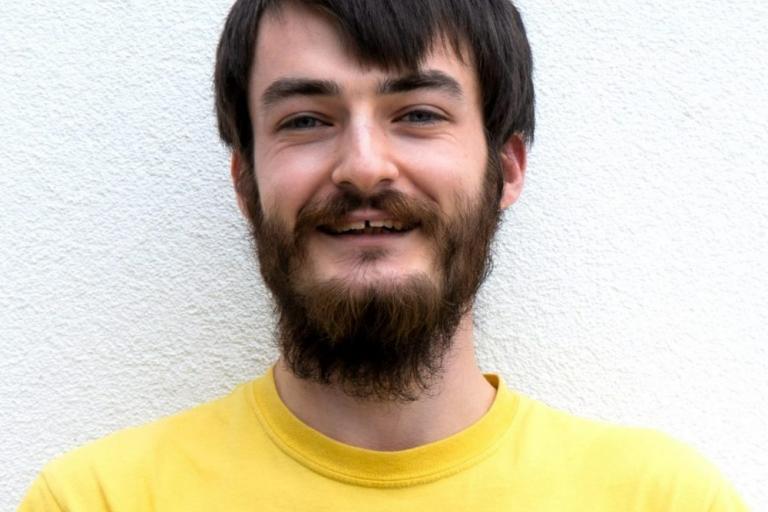
Ishaan Sinha
I am an evolutionary anthropologist interested in the evolution of cognition. For my PhD, I am working on the evolution of behavioural variation and social learning, employing analytical and agent-based modelling. I also demonstrate on a fair few statistics courses here at Penryn. During my masters, I worked with Bayesian phylogenetics. Thus, I can help you out with a host of things, from theoretical modelling to Bayesian statistics to standard fare such as t-tests and linear regression. Moreover, I have experience with a variety of data visualisation methods including ggplot2 and matplotlib as well as general data analysis. Apart from R, I also use Python and Julia. I know statistics can be confusing and so I can help you make sense of your approach, data, and results.

Jaimie Barnes
I’m an ecologist and molecular entomologist in training. I completed my bachelors and master’s degrees here in Penryn. I currently study a PhD on the mechanisms of insecticide detoxification in hoverflies. I have ample experience with data analysis and a range of statistics. I can perform simple tests from regressions and t-tests to generalised linear mixed effects models. I also have experience (limited) with survival analysis, GAMs, multinomial regression and KNN analysis. Using R, I can help you analyse your data using the most appropriate methods. Moreover, using ggplot, I can help you visualise your data and results.

Terence McAvoy
I am an evolutionary microbiologist and I am carrying out research into the microbiomes of crops for my PhD. I did both my undergraduate in Conservation Biology and Ecology and subsequently my MRes at the Penryn Campus of the University of Exeter. I have experience in coding in python and R, in modelling and statistical analysis. I'm happy to help with data visualisation and making graphs and statistical analysis, such as linear models, general linear models and generalized linear models (and mixed effect models if needed). I have been teaching assisting on stats courses at the university for a few years now in the biosciences and geography department so am used to the datasets you'll likely be dealing with!